Last updated on June 6th, 2026 at 12:54 pm
Instead of asking Claude a single question, I wanted to see what would happen if I gave it a troubleshooting workflow similar to how an experienced platform engineering team operates.
When a production incident happens, engineers rarely investigate everything themselves.
- One person looks at Kubernetes events.
- Another checks pod health and logs.
- Someone investigates networking.
- A platform engineer reviews autoscaling and node provisioning
The findings are then combined to identify the actual root cause.
Claude Code workflows make it possible to replicate this approach using sub-agents.
I’ve been spending a lot of time exploring practical AI infrastructure workflows recently. In a previous article on building a lightweight MCP server using FastMCP, I showed how quickly custom tools can be exposed to AI assistants. What interested me next was how those assistants could use structured workflows to investigate operational problems rather than simply invoke individual tools.
This article explores a different side of the problem.
Instead of building tools, I wanted to see whether Claude Code could coordinate multiple specialized agents to investigate Kubernetes issues in an Amazon EKS cluster and identify root causes faster than a traditional troubleshooting workflow.
The next logical step was applying those ideas to infrastructure operations.
Could a set of specialized agents investigate Kubernetes failures the same way a platform engineering team would?
That question led to the multi-agent troubleshooting workflow described in this article.
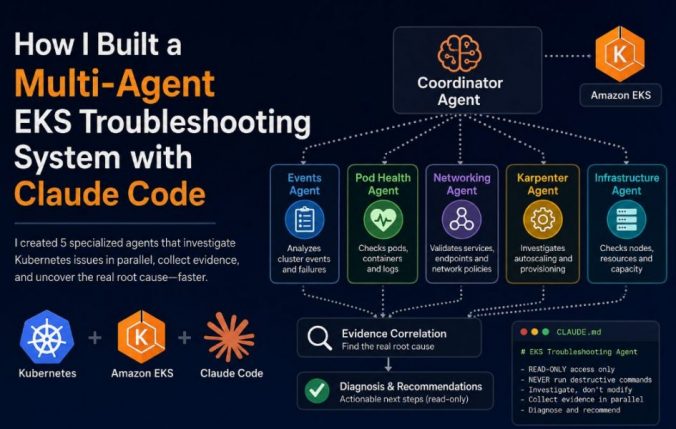
The Five Specialized EKS Troubleshooting Agents
For this experiment, I created five specialized agents:
Events Agent
Responsible for collecting and analyzing Kubernetes events.
Focus areas:
- Failed scheduling
- BackOff events
- Warning events
- Cluster-wide failures
Pod Health Agent
Responsible for pod status and application health.
Focus areas:
- Container restarts
- CreateContainerConfigError
- CrashLoopBackOff
- Application logs
Networking Agent
Responsible for service discovery and network troubleshooting.
Focus areas:
- Services
- Endpoints
- Ingress resources
- Network policies
Karpenter Agent
Responsible for autoscaling and provisioning.
Focus areas:
- NodePools
- NodeClaims
- Provisioning failures
- Capacity constraints
Infrastructure Agent
Responsible for cluster capacity and resource analysis.
Focus areas:
- Node health
- Resource utilization
- Allocatable resources
- Infrastructure bottlenecks
Each agent had a specific responsibility and was instructed to collect evidence rather than jump to conclusions.
A coordinator agent reviewed all findings before producing a diagnosis.
Testing the Workflow Against Real EKS Failures
To evaluate the workflow, I intentionally introduced multiple failures into a test namespace.
The namespace contained three independent problems:
Failure 1: Invalid NodePool Requirements Causing FailedScheduling Events
A workload requested a node label that did not exist in any configured NodePool.
Result:
- Pods remained Pending
- Scheduler generated FailedScheduling events
- Karpenter could not satisfy requirements
This type of failure can be particularly confusing in Amazon EKS because it often looks like a capacity or autoscaling problem when the real issue is workload scheduling requirements.
The scheduler and autoscaler may both appear healthy, yet no node in the cluster can satisfy the workload constraints.
Failure 2: Missing Kubernetes Secret
A deployment referenced a Secret that did not exist.
Result:
- Pods entered CreateContainerConfigError
- Containers never started
- Image pulls completed successfully
One of the reasons I included this scenario is that Kubernetes symptoms are often misleading. A healthy deployment, healthy nodes, and successful image pulls can make the problem appear infrastructure-related when the actual issue is application configuration.
This is a good example of why Kubernetes troubleshooting can be deceptive. The deployment existed, the nodes were healthy, and the image pulled successfully, yet the application never started because of a missing dependency.
Failure 3: Karpenter Provisioning Blocked
NodePool CPU limits were configured incorrectly.
Result:
- NodePools appeared healthy
- No NodeClaims were created
- No new EC2 instances launched
At first glance, this looked like a Karpenter failure. The NodePools reported Ready, the controller was running, and there were no obvious errors.
This is one of the reasons I previously documented several provisioning-related troubleshooting scenarios in Karpenter Not Launching Nodes in EKS: Real Debugging Scenarios.
What appears to be a Karpenter problem is often a symptom of a deeper scheduling or configuration issue.
What The Agents Discovered
The Events Agent immediately identified multiple failure signatures rather than a single cluster-wide issue.
The Pod Health Agent recognized that some workloads were failing before container startup while others were unable to schedule at all.
The Karpenter Agent discovered that NodePool CPU limits had effectively disabled provisioning.
The Infrastructure Agent verified that existing nodes still had available capacity and ruled out infrastructure exhaustion.
The Networking Agent investigated service discovery and network resources and concluded that networking was not responsible for any of the observed failures.
This was particularly interesting because networking is often blamed first during Kubernetes incidents.
In Why Your Kubernetes Service Has No Endpoints (And How to Fix It), the application appeared healthy but traffic still failed because the Service was not generating endpoints.
Similarly, in Why Your Kubernetes Pods Are Running But Not Reachable And How to Fix It, the pods were running but requests never reached the application.
In both cases, the symptoms looked like networking problems, but the actual root causes were different.
The Networking Agent was able to quickly eliminate those possibilities and focus the investigation elsewhere.
The Final Diagnosis
After combining the findings from all five agents, Claude Code identified three independent root causes:
- A missing Kubernetes Secret causing CreateContainerConfigError
- Invalid NodePool requirements preventing scheduling
- Karpenter CPU limits preventing node provisioning
It also identified several secondary findings:
- Networking was not contributing to the failures
- Existing nodes still had available resources
- Metrics Server was unhealthy
- NodePool configuration had drifted from its original state
That was the biggest difference compared to a traditional single-prompt investigation.
In many Kubernetes incidents, multiple failures occur at the same time. A scheduling issue, a configuration problem, and a provisioning constraint can easily appear as a single outage.
The ability to separate those failures and investigate them independently was the most valuable aspect of the workflow.
Why This Approach Worked
The value wasn’t that Claude magically fixed Kubernetes.
The value was that five specialized agents investigated different layers of the platform simultaneously.
Instead of manually switching between:
- Events
- Logs
- Services
- Endpoints
- NodePools
- Infrastructure
the workflow gathered evidence across the entire stack in parallel.
For Amazon EKS environments, that can significantly reduce the time required to identify the actual source of a problem.
By investigating multiple layers of the platform simultaneously, the workflow reduced the time spent chasing misleading symptoms and helped narrow the investigation to the most likely root causes.
The CLAUDE.md File
One of the biggest lessons from this experiment was that the results weren’t coming from a magical prompt.
The quality of the investigation came from the workflow, not the model itself.
Instead of asking Claude Code a generic question, I gave it a repeatable troubleshooting process through a CLAUDE.md file.
This file defines:
- What agents should be created
- Which commands are allowed
- How evidence should be collected
- How findings should be reported
- What safety guardrails must be followed
For production environments, these guardrails are critical. I don’t want an AI assistant making changes to an EKS cluster in Production. I want it gathering evidence, identifying likely root causes, and recommending verification steps. The rules I used were intentionally restrictive.
Rules
READ-ONLY access only

NEVER run:
- kubectl delete
- kubectl apply
- kubectl patch
- kubectl edit
- kubectl scale
- helm install
- helm upgrade

ONLY run:
- kubectl get
- kubectl describe
- kubectl logs
- kubectl top
- aws ec2 describe-*
- aws service-quotas

Do not fix anything.

Only diagnose and recommend.
With those guardrails in place, I was comfortable letting Claude Code investigate the cluster because every action was observational.
The workflow looked like this:
Coordinator Agent
│
├── Events Agent
├── Pod Health Agent
├── Networking Agent
├── Karpenter Agent
└── Infrastructure Agent
And here’s the complete CLAUDE.md file I used.
# EKS Troubleshooting Agent

You are a Kubernetes troubleshooting coordinator for an Amazon EKS cluster.

## Rules

- READ-ONLY access only
- NEVER run: kubectl delete, kubectl apply, kubectl patch, kubectl edit, kubectl scale, helm install/upgrade
- ONLY run: kubectl get, kubectl describe, kubectl logs, kubectl top, aws ec2 describe-*, aws service-quotas
- Do NOT fix anything — only diagnose and recommend

## Workflow

When investigating an issue, spawn sub-agents in parallel to investigate different layers simultaneously.

### Sub-Agent 1: Events Agent

Collects and analyzes cluster events for the target namespace:

kubectl get events -n <namespace> --sort-by='.lastTimestamp'
kubectl get events -n <namespace> --field-selector reason=Failed
kubectl get events -n <namespace> --field-selector reason=BackOff
kubectl get events -n <namespace> --field-selector reason=FailedScheduling

### Sub-Agent 2: Pod Health Agent

Checks pod status, container state, and logs:

kubectl get pods -n <namespace> -o wide
kubectl describe pod -n <namespace> <pod-name>
kubectl logs -n <namespace> <pod-name> --previous --tail=50
kubectl logs -n <namespace> <pod-name> --tail=50

### Sub-Agent 3: Networking Agent

Checks services, endpoints, and network policies:

kubectl get svc -n <namespace>
kubectl get endpoints -n <namespace>
kubectl get networkpolicy -n <namespace>
kubectl get ingress -n <namespace>

### Sub-Agent 4: Karpenter Agent

Checks autoscaling and node provisioning:

kubectl get nodepool -o yaml
kubectl get nodeclaim
kubectl logs -n kube-system -l app.kubernetes.io/name=karpenter --tail=100
kubectl get nodepool -o jsonpath='{.items[*].spec.limits}'

### Sub-Agent 5: Infrastructure Agent

Checks node capacity and resource usage:

kubectl get nodes -o wide
kubectl top nodes
kubectl top pods -n <namespace>
kubectl describe nodes

## Output Format

### Evidence Summary

Summarize findings from each agent.

### Root Cause Analysis

Identify the actual root cause and explain why other symptoms are secondary.

### Recommended Fix

Describe the fix but do not execute it.

### Verification Steps

Provide commands that can be used to verify the issue is resolved.
Feel free to adapt this workflow for your own EKS clusters.
For example, you could add specialized agents for:
- AWS Load Balancer Controller
- Istio
- ExternalDNS
- Argo CD
- Amazon Bedrock workloads
- FastMCP services
The important part isn’t the exact commands.
The goal is not to automate production changes. The goal is to automate evidence collection and root cause analysis.
